

Labor Market Burns as GOP Pours Gasoline On It
The passage of the “Big Beautiful Bill” all but guarantees recession and employment disaster for years to come.

By Max from UNFTR
Republicans and Wall Street pundits were touting the increase in non-farm payroll figures while the GOP-led House approved the Senate version of the Big Beautiful Bill Act that will add $3.3 trillion to the U.S. debt. But the real story behind the labor market data paints a very ugly picture of what’s really going on with the American worker.
There’s a sinkhole opening up in the labor market being masked by demographic reporting metrics, stock market performance and the recently released payroll figures.
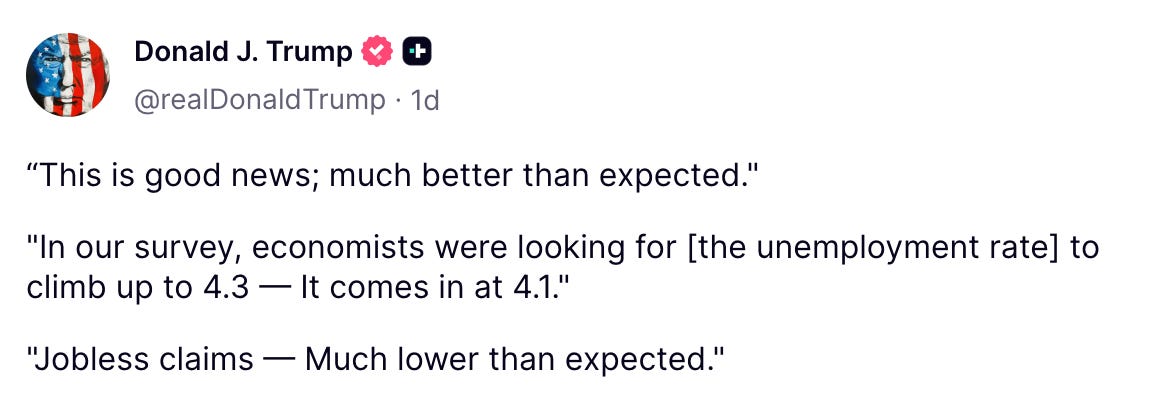
The release of extremely mediocre but “better-than-expected” non-farm payroll numbers had everyone in the GOP in a pretty good mood, especially you know who…
Treasury Secretary Bessent took to the airwaves to crow about the possibility of 3% growth in the back of 2025, which would be the most stunning turn of events ever considering the first quarter GDP figures were revised downward to -.5%.
The GOP needed this as an emotional boost heading into the last round of voting in the House. Just two days prior, the ADP report stunned observers when they came in negative (-33,000) instead of the +100,000 the market expected. But when the non-farm payroll numbers came in at 147,000 it seemed to give the GOP the confidence to push forward with the bill.
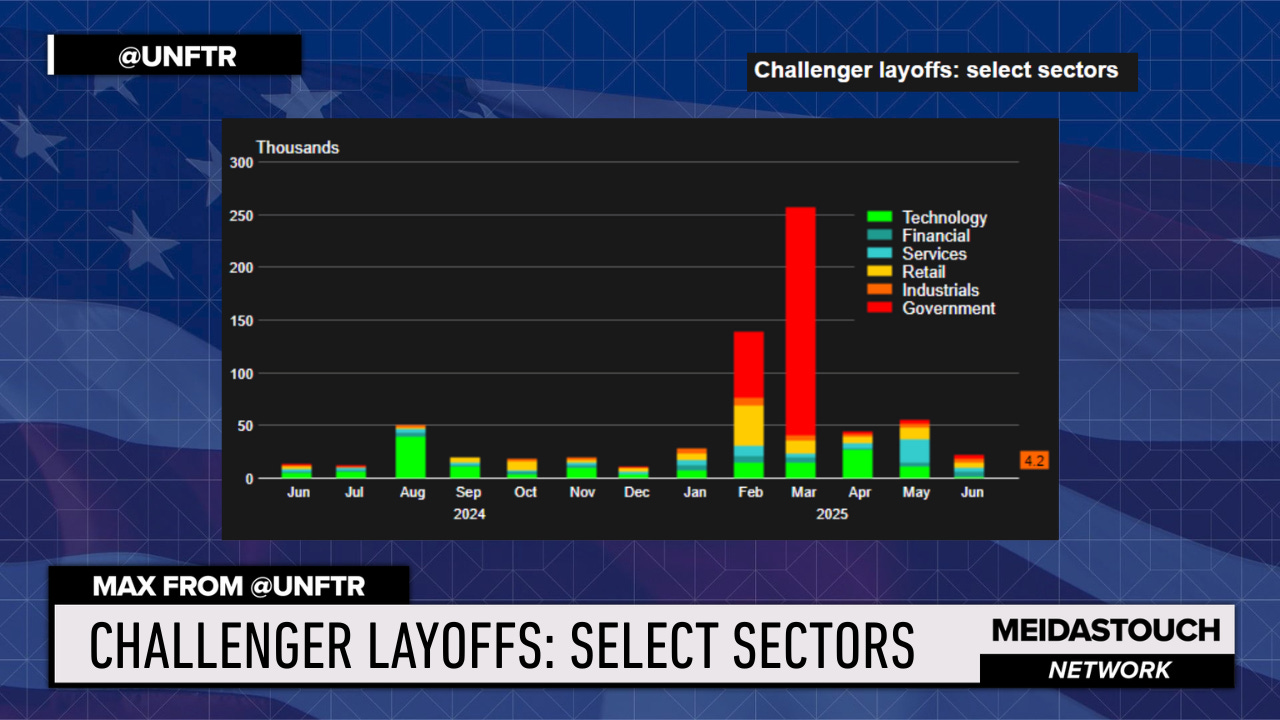
Here’s how these top line numbers work to mask the underlying data that no one seems to want to talk about. The pundit class looks at figures such as the Challenger, Gray and Christmas report known informally as the “Challenger Layoffs” and say things are improving compared to the previous quarter when DOGE was laying off government employees. As you can see below, June is better than May but if you go back to the end of the Biden summer numbers, they’re nearly double.
It’s important to understand the nature of employment, who is counted in government reports and who is not. What matters is “Participation” and it’s in these numbers where things fall apart.
Participation vs. Employment
Below is the labor participation rate. We’ve covered this briefly before, but essentially the Federal Reserve and other agencies monitor this along with something called the Prime Age Participation Rate. The difference being that this chart measures everyone above the age of 18 who isn’t in school, the military or on qualified disability, and shows what percent of all Americans in this category have employment - and that’s all kinds of employment, full-time, enough part-time to not be on unemployment, gig work, etc.
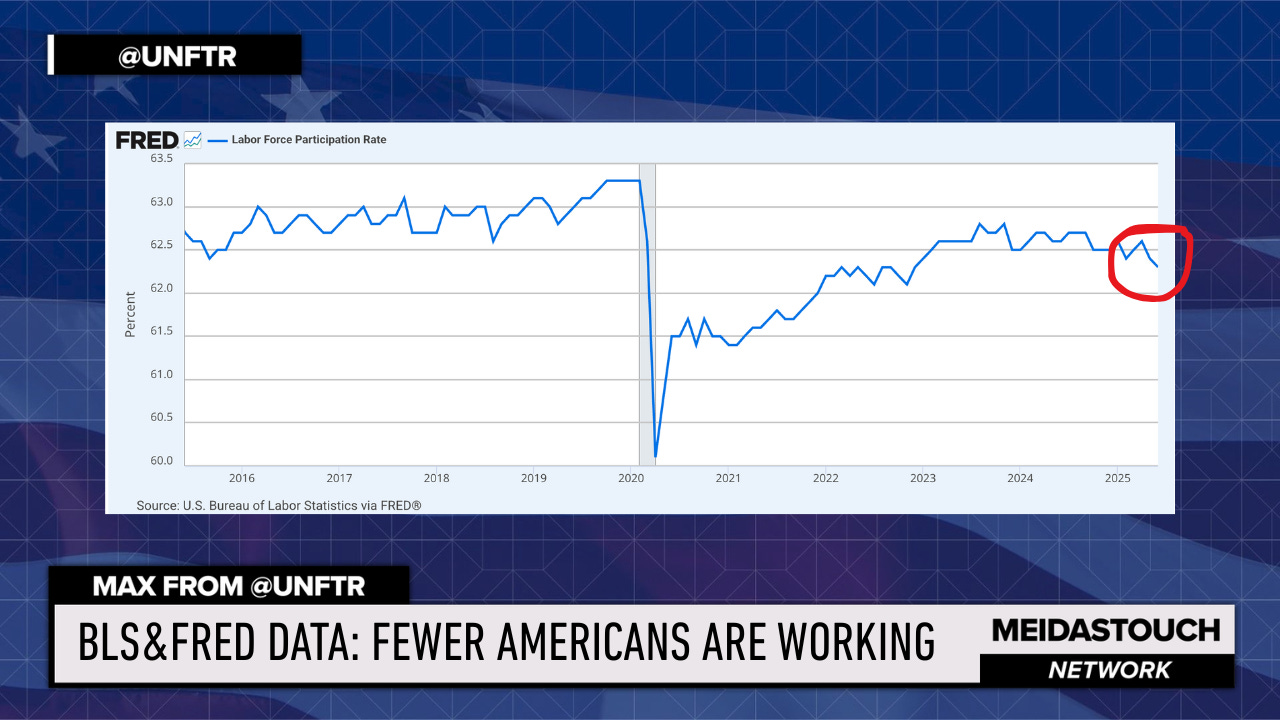
So even though we added all these jobs and the unemployment rate technically fell to 4.1% in June, fewer people in America are working. That’s the dip in the red circle there.
“What the GOP just did is divert the path toward a cliff for a substantial portion of this population that was already dangerously close to the edge.”
So think about that number for a second before we go to the next chart. 62% of Americans above the age of 18 and not in school or the military are not working. That seems bad, right?
Hold that thought and let’s drill down a little further.
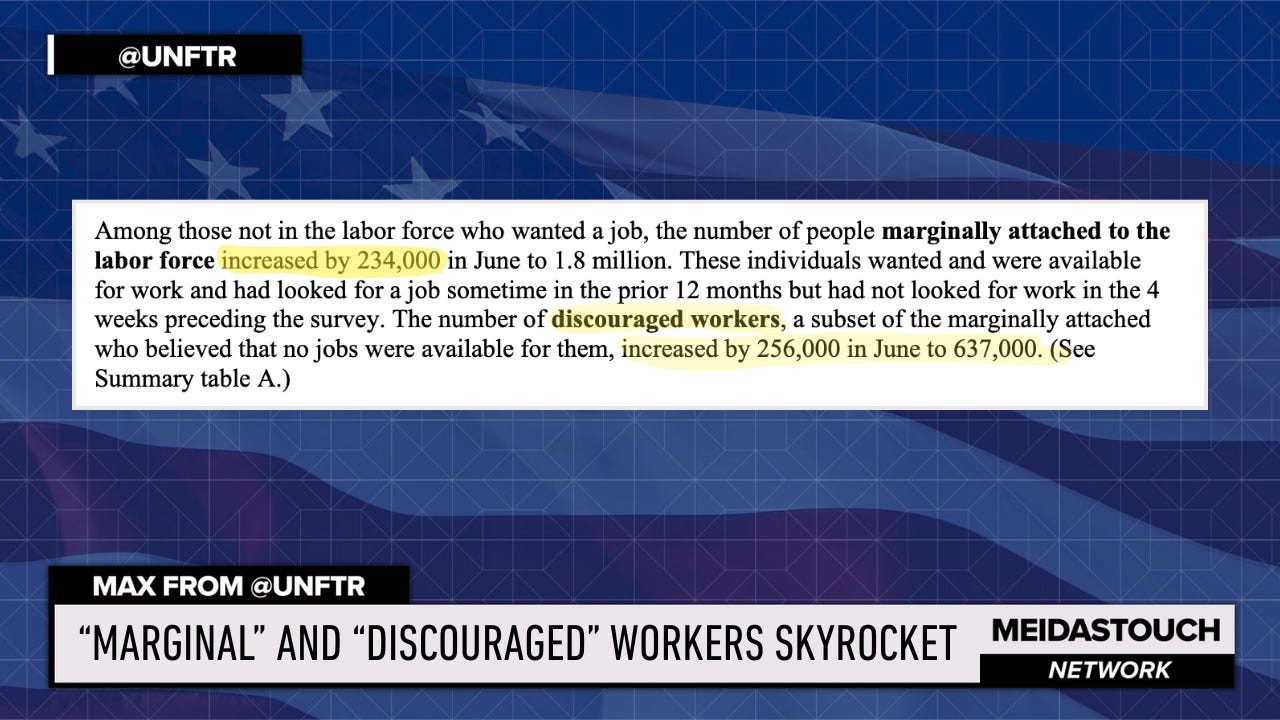
This chart is from the Bureau of Labor Statistics and it measures Americans who are considered “marginally” attached to the labor force and the number of “discouraged” workers who are out of the workforce and think there’s nothing for them.
Marginal workers increased by 234,000 in June and discouraged workers went from 256,000 to 637,000.
To be clear, these marginally attached workers aren’t working but indicated they had at least looked for a job in the last twelve months. The discouraged workers have all but given up.
You can already start to see that the numbers and optimism aren’t really adding up, right? Well, hang tight and let’s drill even deeper.
Okay, so this one is a little text heavy so just focus on the highlighted figures for a moment because this is where things start to crystallize about what’s happening in the labor market.
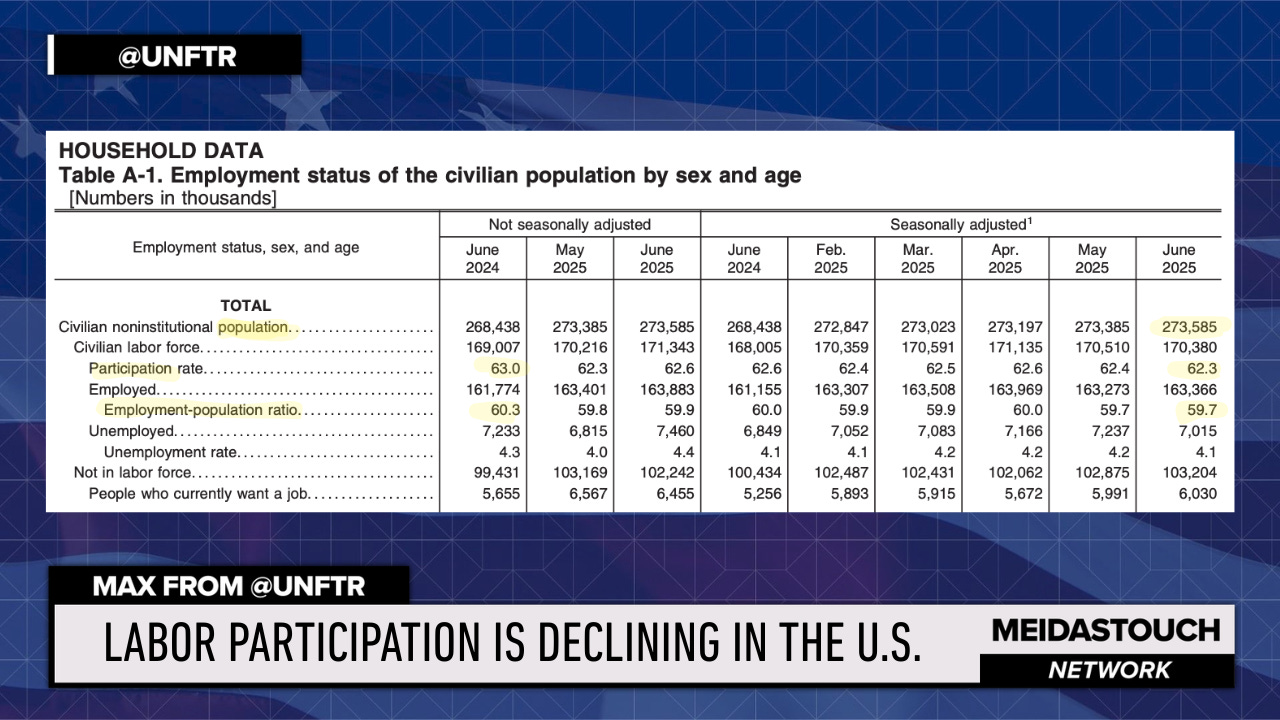
As of June, 2025 there are 273 million Americans above 18 years old and not in college or the military. This is the absolute total from 18 to death of people who can theoretically work. So you see on the right side, there’s our 62% participation rate. Compared to last year at the same time (all the way to the left), it’s down a full percentage point. But this still counts the people in “unemployment” who had a job but lost it and are actively seeking another one. So if we take those people out the TRUE participation is 59%, which is down from 60% the same time last year.
Now I want you to think about this in the context of the bill that just passed.
Forget the 18 and over and just take the raw figure, the total population of the United States. According to the last census it’s around 347 million people.
So technically 163 million out of 347 million people have jobs. That’s actually 47% of ALL Americans.
47% of Americans work to support the other 53%. This is the labor market everyone is bragging about.
People under 18 aren’t really supposed to work, right? So why does that matter?
First off, less than half of the population now - officially - is supporting more than half. This is the absolute reality of the United States right now and it’s only going to get worse because we have declining birth rates and more Boomers are retiring every month. But the real impending crisis is that a large portion of the true unemployed in this country physically can’t work, can’t find meaningful work where they live or are at home caring for kids or the elderly.
And the GOP Senate just threw an entire chunk of that population into absolute crisis by taking away life saving benefits such as Medicaid and SNAP.
So look, we were on an unsustainable path to begin with. But what the GOP just did is divert the path toward a cliff for a substantial portion of this population that was already dangerously close to the edge. All so they could save money to cover their tax breaks.
More people are going to find themselves in need of a hand out and a hand up. But they won’t be able to look to the government, which means the non-profit sector will need to step up to fill the gap. And here’s where the GOP closes the show with the middle finger.
Uncharitable
The final version of the bill includes several provisions that decrease the value of charitable deductions, which experts and nonprofit advocates warn could negatively impact charitable giving. According to the National Council of Nonprofits the bill caps itemized deductions and sets a floor for itemized charitable deductions; it discourages corporations as well with a 1% floor.
All told, they estimate an $81 billion decrease in charitable giving over the next decade.
This is the stuff that makes you realize how depraved the GOP is. The only thing they made more difficult for millionaires and billionaires was giving money to charity. If you’re wondering why they would do such a thing, I would implore you to read Project 2025. They are truly coming through on their bizarro libertarian Darwin ideas to thin the herd. They are okay if more poor people die.
Max is a contributor to the MeidasTouch Network and Publisher of UNFTR Media.
For deeper dives into economic and socioeconomic stories, visit UNFTR.com or @UNFTR on YouTube.
The Labor Department plays with the employment numbers and the Trump administration plays the most. Bessent is not even a good liar. We’ve tried the trickle down theory in every Republican administration since Reagan and it has never worked. The question is how devastating the economic turndown will get-stagflation or recession.
People will only start caring about the deconstruction of the nation when it impacts them directly.